Charts
To include any of the custom charts from Browbeat in a scenario, the following lines will have to be included in the python file of the program.
import sys
import os
sys.path.append(os.path.abspath(os.path.join(os.path.dirname(__file__), '../reports')))
from generate_scenario_duration_charts import ScenarioDurationChartsGenerator  # noqa: E402
The custom charts will appear in the “Scenario Data” section of the Rally HTML report.
Chart - add_per_iteration_complete_data
This plugin generates a stacked area graph for duration trend for each atomic action in an iteration. To include this chart in any scenario, add the following lines at the end of the run() function of the scenario in the python file.
self.duration_charts_generator = ScenarioDurationChartsGenerator()
self.duration_charts_generator.add_per_iteration_complete_data(self)
The graphs will appear under the “Per iteration” section of “Scenario Data” in the Rally HTML report. The resulting graphs will look like the images below.
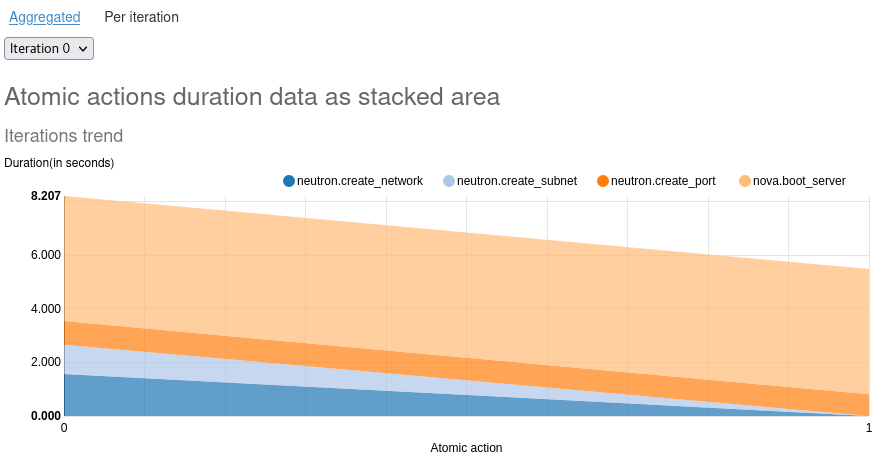
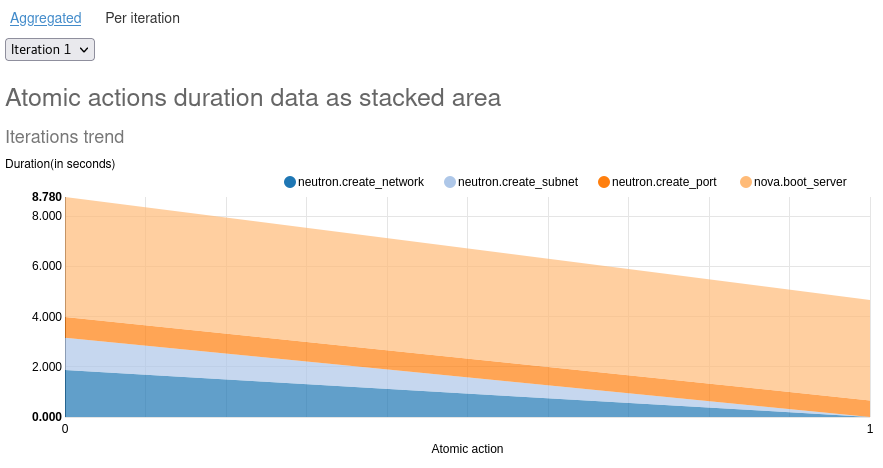
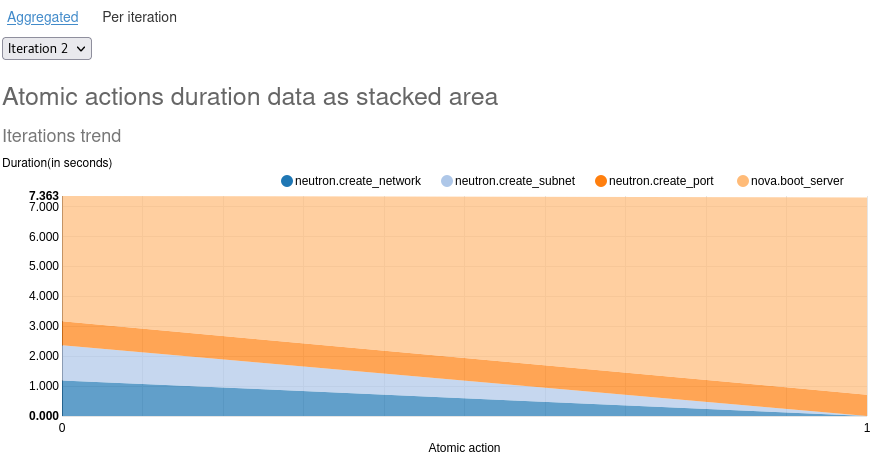
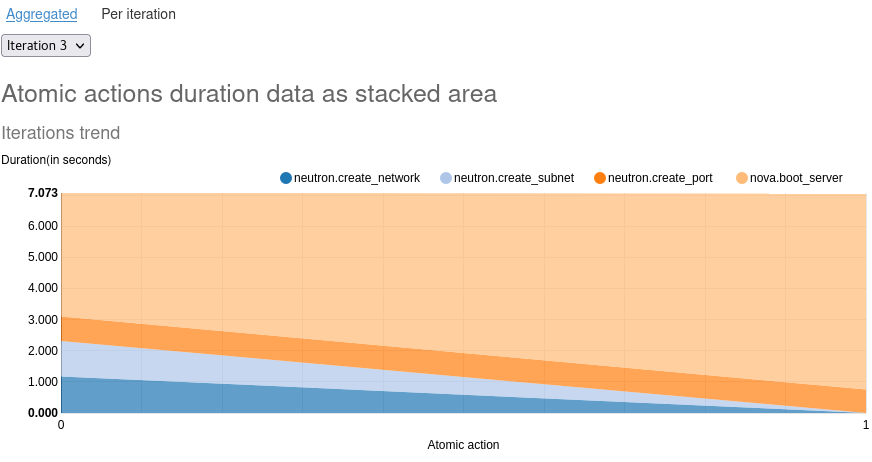
Chart - add_duplicate_atomic_actions_iteration_additive_data
This plugin generates line graphs for atomic actions that have been executed more than once in the same iteration. To include this chart in any scenario, add the following lines at the end of the run() function of the scenario in the python file.
self.duration_charts_generator = ScenarioDurationChartsGenerator()
self.duration_charts_generator.add_duplicate_atomic_actions_iteration_additive_data(self)
The graphs will appear under the “Aggregated” section of “Scenario Data” in the Rally HTML report. The resulting graphs will look like the images below.
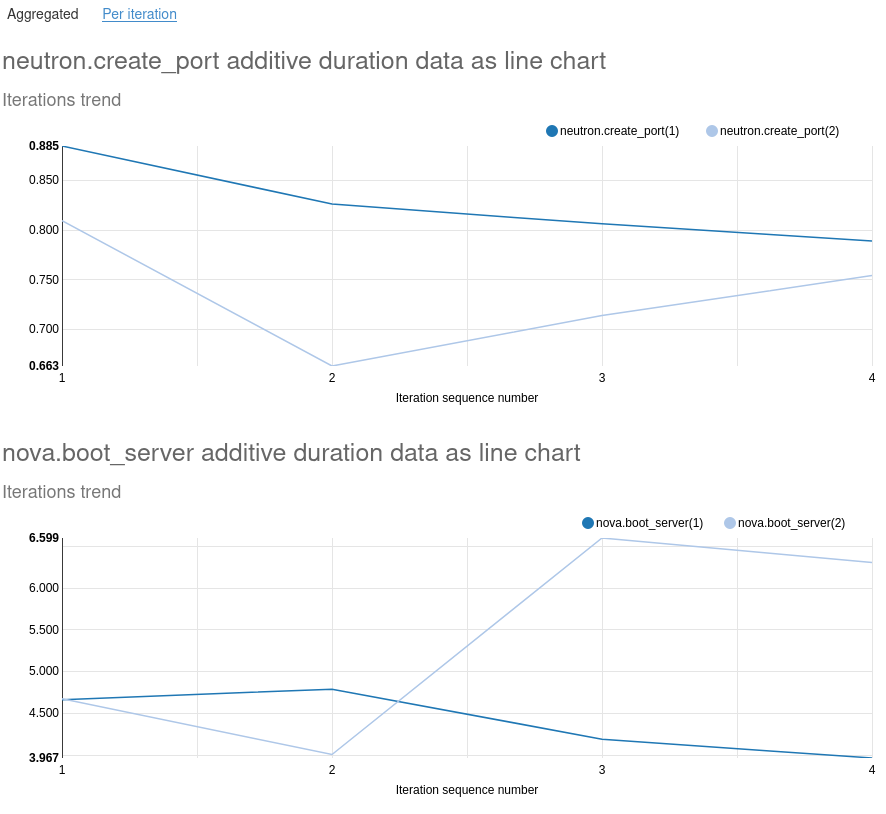
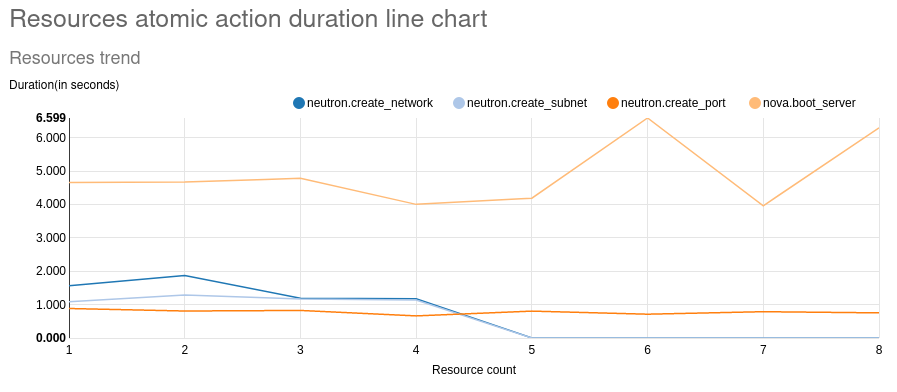
Chart - add_all_resources_additive_data
This plugin generates a line graph for duration data from each resource created by Rally. To include this chart in any scenario, add the following lines at the end of the run() function of the scenario in the python file.
self.duration_charts_generator = ScenarioDurationChartsGenerator()
self.duration_charts_generator.add_all_resources_additive_data(self)
The graphs will appear under the “Aggregated” section of “Scenario Data” in the Rally HTML report. The resulting graphs will look like the images below.